rF2 Stint Visualizer
I recently started playing racing simulators and joined a league that mimics the real Formula 1 championship. These cars are really challenging and unpredictable, especially with my experience. Another key aspect to consider is tire strategy. There are several compounds that offer different levels of traction, wear, and overall speed. A good strategy can help you gain positions, while a bad one can undermine solid driving.
Before the season started, I had the following questions:
- What strategies do other drivers prefer?
- How long does each compound last?
- What is the predominant tire choice?
I knew that more experienced drivers would have the answers. Although I could interview all 20+ participants from the previous championship, that would be a lot of work. People might be unwilling to share, they could forget details, or their memories might be wrong.
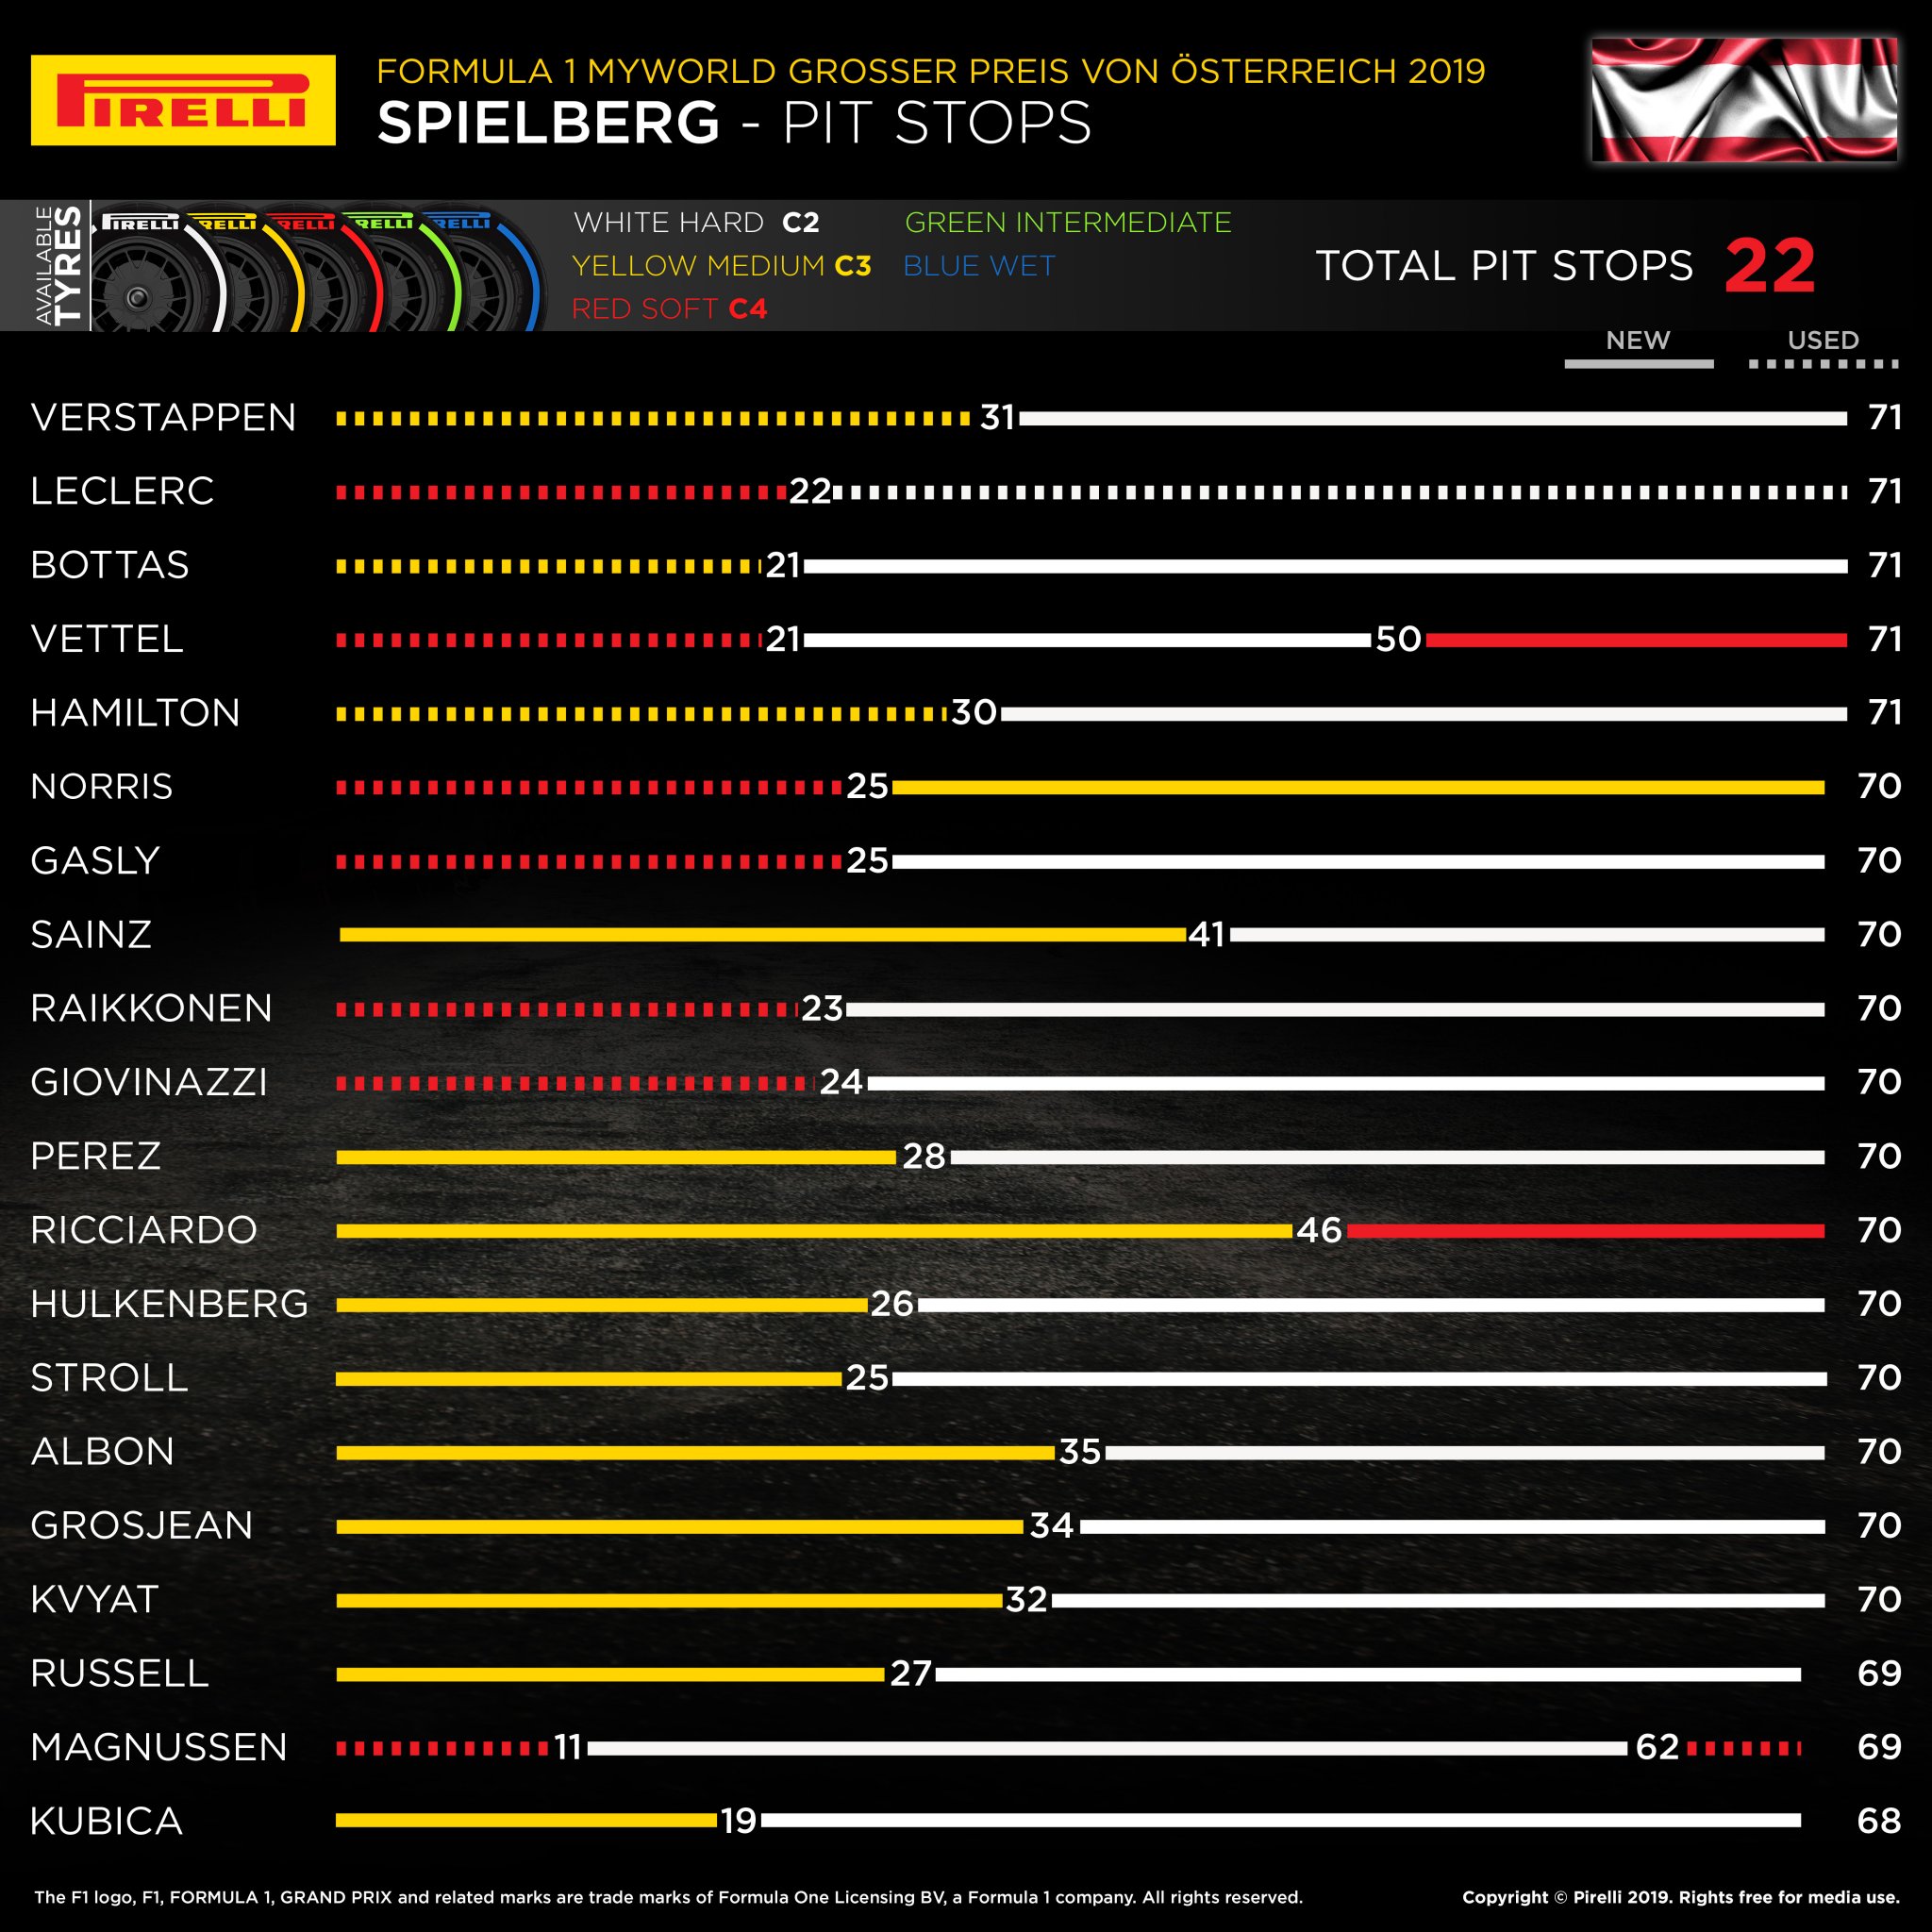
I wanted objective, easy to understand data, similar to an infographic created by Pirelli for the actual races.
Luckily, rFactor 2 stores tire compound data in its race log files. All I needed to do was parse these files and generate something similar.
rF2 Stint Visualizer
As I am familiar with HTML, CSS, and React, I decided to create a web app. The app operates on the client side, allowing me to build and share it without any dependencies. It can even be hosted as a static website.
After learning how to parse XML files in JavaScript, I created a tool that generates infographics in less than a second.
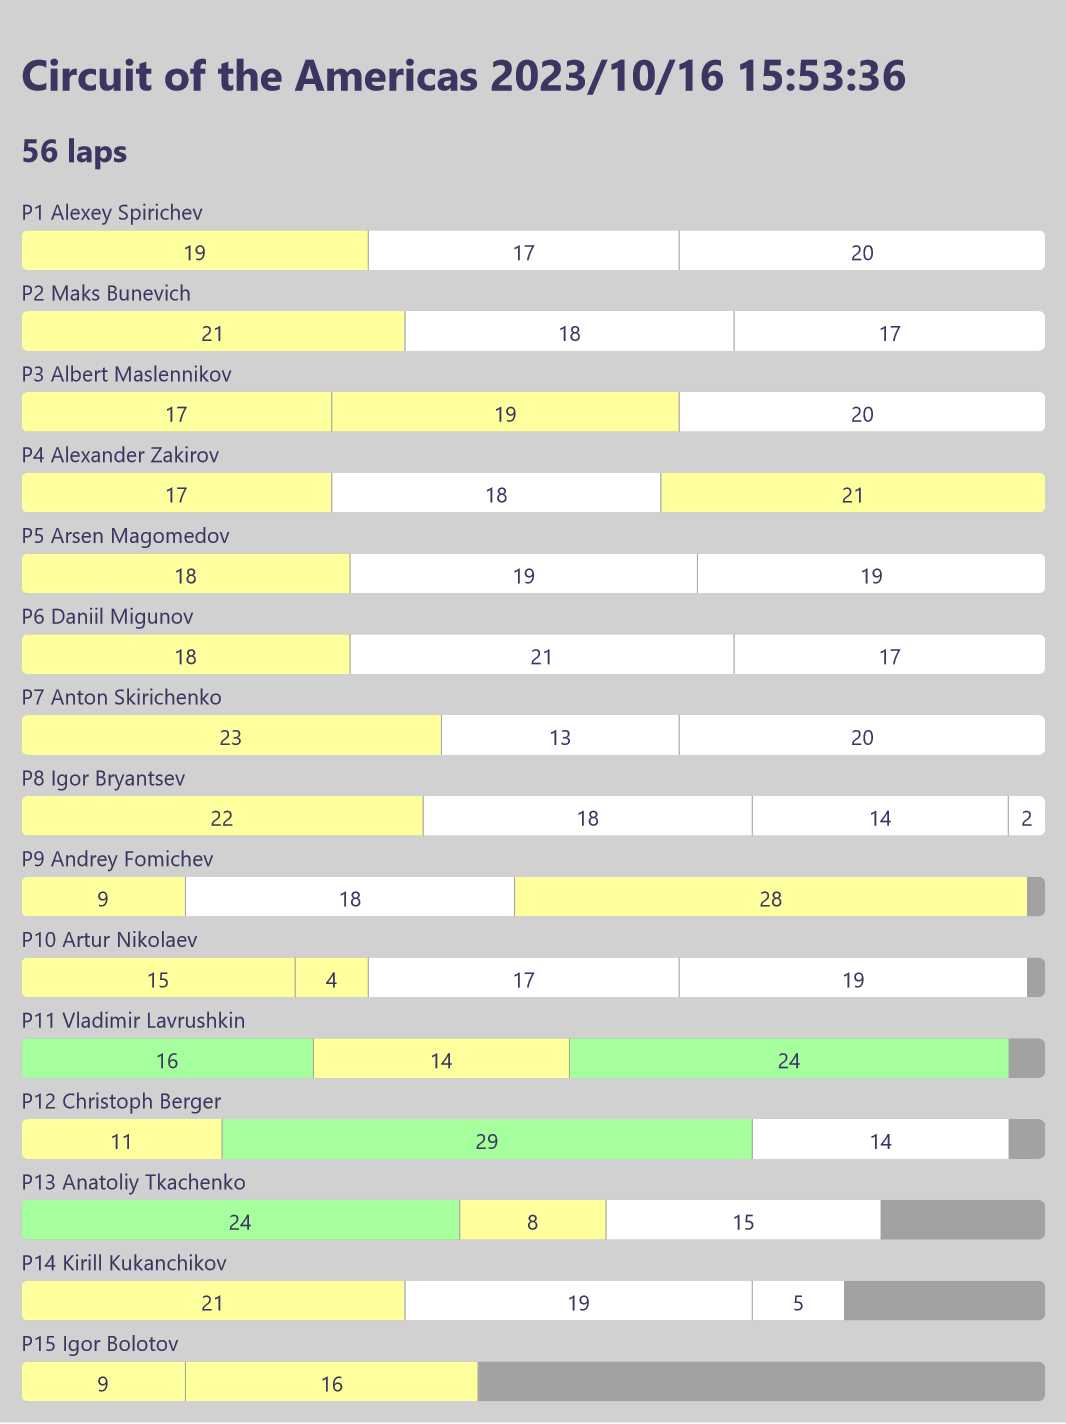
Color codes:
- Soft => white color
- Medium => yellow color
- Hard => green color
- Wet => blue color (not used in this example)
Drivers below 8th place did not finish, so their bars are not fully filled.
The visual aspect isn't stunning, but it's functional. This visualization helps me see that most drivers prefer the soft compound, with the only stint on the optional tire being on mediums. In Formula 1, drivers must use two different compounds during the race. The hard tire is not very popular.
It is what it is: a minimum viable product, the code is a mess, but it does its job, so I decided to publish it. See the project on GitHub.
Issue with logs
rFactor 2 logs present at least two major issues:
- Tires are not always synchronized correctly with other drivers in the session.
- Pit stops are not always synchronized correctly with other drivers in the session.
Unfortunately, this means that you need the server log to generate accurate reports; otherwise, some stints and tires will be displayed incorrectly.

